Follow the Giants: Decoding Institutional Crypto Moves Before the Market Reacts

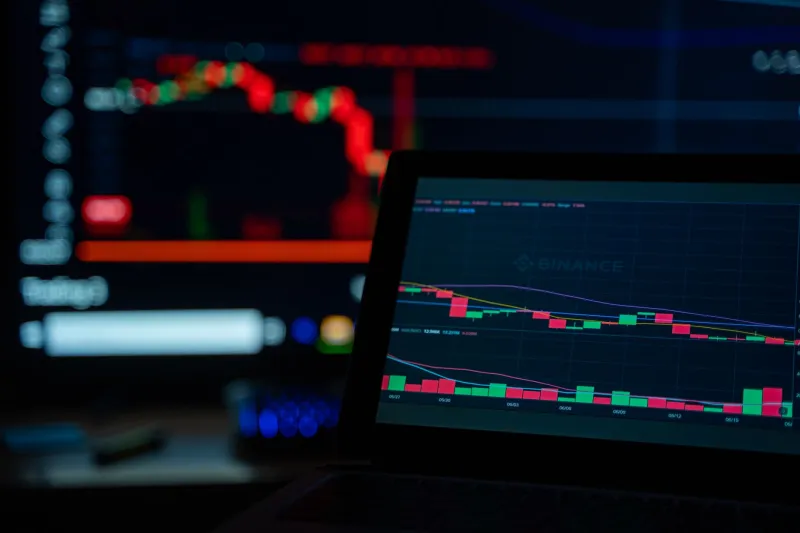
Photo: institutional investor analyzing financial data on multiple screens cryptocurrency charts, via thumbs.dreamstime.com
In traditional financial markets, institutional investors operate behind closed doors — hedge funds file quarterly disclosures, and by the time the public sees the data, the trade is long over. Crypto, however, is different. Every transaction is permanently recorded on a public ledger. The giants still move, but they leave a trail that any investor with the right tools and the patience to read it can follow.
The challenge is not access — it is interpretation. Raw blockchain data is noise until you know what patterns to look for. This guide is designed to cut through that noise and give US investors a systematic approach to tracking smart money before it moves markets.
Why Institutional Behavior Drives Crypto Price Action
Retail participation in crypto has grown considerably, but the outsized price movements that define crypto market cycles are still overwhelmingly driven by large-capital actors. These include crypto-native funds, family offices, corporate treasuries, and increasingly, regulated institutional vehicles such as spot Bitcoin ETFs. When these entities accumulate, distribute, or reposition, the market follows — often with a lag of hours to days.
Understanding this dynamic reframes how you should approach your analysis. Rather than reacting to price, your goal is to anticipate the conditions that cause price to move. Institutional positioning is one of the most reliable leading indicators available.
Exchange Flows: The First Signal to Watch
One of the most actionable data streams for tracking large-money behavior is exchange net flow — the difference between crypto moving onto exchanges and crypto moving off them. The logic is straightforward: assets held on exchanges are available for sale, while assets moved into cold storage or private wallets signal long-term holding intent.
When large quantities of Bitcoin or Ethereum begin flowing off major exchanges consistently over several days, it often precedes upward price pressure. The supply available to sellers is shrinking. Conversely, significant inflows to exchanges — particularly from wallets that have been dormant for extended periods — can signal that long-term holders are preparing to distribute.
Platforms such as CryptoQuant, Glassnode, and Nansen provide this data in near real time. For US investors, monitoring the exchange reserve metric for Bitcoin and Ethereum should be a standing part of any weekly analytical routine.
Large Wallet Transfers and the Significance of Address Clustering
Not all large transactions are equal. A $200 million Bitcoin transfer between two wallets controlled by the same custodian is operationally neutral. A $200 million transfer from a known institutional accumulation address to a major exchange is a materially different signal.
This is where address clustering and wallet labeling become critical. Blockchain analytics firms have invested years into identifying and tagging wallet addresses associated with known entities — exchanges, funds, miners, and over-the-counter desks. When a large, labeled wallet initiates a significant transfer, it is possible to infer intent based on the destination.
Nansen's "Smart Money" tracker is particularly useful here. It aggregates the behavior of wallets with historically profitable trading records and surfaces their current positioning. When a cluster of smart money addresses begins accumulating a specific token — especially outside of exchange infrastructure, suggesting OTC or direct acquisition — it is a signal worth investigating further.
OTC Desk Activity and the Accumulation Phase
Institutional investors rarely acquire large positions through open-market order books. Doing so would move the price against themselves. Instead, they use over-the-counter desks, which match large buyers and sellers off-exchange. OTC activity does not always appear immediately in public data, but its effects are visible.
One proxy is the stablecoin supply ratio — the ratio of stablecoins sitting on exchanges relative to the total market capitalization of assets like Bitcoin. When this ratio rises sharply, it indicates that large amounts of purchasing power are being staged on exchanges, potentially in preparation for deployment. A rising stablecoin supply ratio paired with declining Bitcoin exchange reserves is one of the more reliable combinations signaling institutional accumulation.
Additionally, monitoring the premium or discount on institutional products such as the Grayscale Bitcoin Trust (GBTC) or the flow data published by spot Bitcoin ETF issuers provides a regulated, auditable window into how large US-based capital allocators are positioning themselves.
Behavioral Psychology and the Patience Premium
Tracking institutional money is not purely a technical exercise. It requires understanding the behavioral incentives of large players. Institutions operate under constraints that individual investors do not: they have mandates, reporting cycles, and risk committees. These constraints create predictable patterns.
For example, institutional accumulation tends to accelerate near the end of calendar quarters as portfolio managers finalize allocations. It also tends to cluster around technical levels that algorithmic systems are programmed to recognize — major moving averages, historical support zones, and round-number price thresholds. When you see large wallet activity concentrating near these levels, the probability that it is intentional positioning rather than noise increases substantially.
Patience is the premium that separates the investor who uses these tools effectively from the one who chases every signal. Not every large transfer is a trade trigger. The discipline is in waiting for confluence — multiple indicators pointing in the same direction before committing capital.
Building Your Institutional Monitoring Stack
For US investors ready to integrate this approach into their process, the following toolkit represents a practical starting point:
- Glassnode: Best-in-class for on-chain metrics including exchange net flow, HODL waves, and realized price analysis.
- Nansen: Superior wallet labeling and smart money tracking, particularly useful for Ethereum and EVM-compatible chains.
- CryptoQuant: Strong exchange-specific data and miner flow analytics.
- Arkham Intelligence: Emerging platform with sophisticated address de-anonymization and entity tracking capabilities.
- ETF Flow Dashboards: The websites of major issuers such as BlackRock (iShares) and Fidelity publish daily Bitcoin ETF flow data, offering a transparent view of regulated institutional demand.
Combining these sources into a weekly review process — rather than checking them reactively during volatile sessions — builds the analytical muscle memory that separates informed positioning from emotional reaction.
The Edge Is in the Preparation
Markets reward those who arrive before the crowd. Institutional money does not move silently — it moves visibly, for those trained to read the chain. The on-chain tools available today give US investors an unprecedented ability to observe the behavior of the largest market participants in near real time.
At King88 Group, we believe that the investors who will consistently outperform are those who treat blockchain data as a primary research source, not an afterthought. Trade bold. Invest smart. And learn to follow the giants before the rest of the market even knows they moved.