The Liquidation Map: Positioning Ahead of Forced Selling Events in Crypto Markets
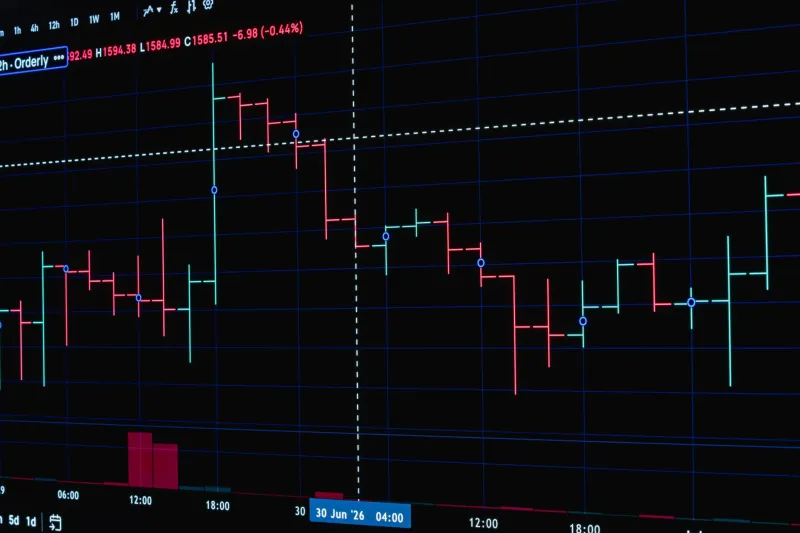
Every leveraged position in the crypto market carries a hidden expiration date. When price moves against a trader who has borrowed to amplify their exposure, the exchange does not negotiate — it liquidates. Collateral is seized, positions are closed at market, and the resulting sell pressure hits the order book whether the broader market is ready for it or not.
For the uninitiated, liquidation events look like chaos. For the prepared trader, they are among the most structurally predictable occurrences in the entire crypto market cycle.
Understanding Why Liquidations Create Opportunity
Leverage trading is ubiquitous in crypto. Platforms including Binance Futures, Bybit, dYdX, and GMX collectively process billions of dollars in leveraged positions daily. When a trader opens a 10x long position on Bitcoin, they are effectively wagering that price will not decline by more than 10% before they close or adjust the trade. If it does, their collateral is automatically liquidated to cover the loss.
The key insight is that these liquidation thresholds are not random — they cluster at technically significant price levels. Traders tend to set stop-losses and open leveraged positions near round numbers, prior support zones, and moving average confluences. This means that when price approaches these levels, an unusually large volume of forced selling is waiting just below.
When one liquidation triggers, the resulting sell pressure pushes price down further — triggering the next cluster of liquidations, then the next. This cascade dynamic is what creates the sharp, violent downward moves that look inexplicable on the surface but are entirely legible to traders who monitor liquidation data.
Reading the Liquidation Heatmap
Several platforms now publish liquidation heatmaps and real-time data that allow traders to visualize where clustered liquidations exist across the price spectrum. CoinGlass is the most widely used tool for this purpose in the US market, offering liquidation data aggregated across major centralized exchanges.
The heatmap displays price levels on the vertical axis and time on the horizontal axis, with color intensity indicating the dollar volume of positions that would be liquidated at each price point. Bright yellow or orange clusters represent high-density liquidation zones — price levels where a significant volume of leveraged positions would be forcibly closed if reached.
A disciplined trader uses this data not to predict where price will go, but to understand what will happen if price reaches a given level. The combination of directional analysis and liquidation awareness creates a materially sharper entry framework than technical analysis alone.
Identifying High-Probability Cascade Scenarios
Not every liquidation cluster produces a tradeable cascade. The following conditions elevate the probability that a liquidation event will create a meaningful, exploitable price dislocation:
High open interest relative to recent norms. When total open interest on a given asset is elevated compared to its 30-day average, the market is carrying more leveraged exposure than usual. This amplifies the impact of any liquidation trigger. CoinGlass and Glassnode both provide open interest trend data for major assets.
Funding rate extremes. In perpetual futures markets, funding rates reflect the cost of holding leveraged positions. When funding rates are significantly positive, the market is heavily long and those positions are paying a premium to remain open. A sharp funding rate spike followed by a rapid reversal often precedes a long squeeze — a scenario where cascading long liquidations drive price down rapidly.
Thin order book depth. Liquidation cascades are most violent when the order book lacks sufficient buy-side depth to absorb forced selling. Monitoring order book depth through exchange APIs or tools like Bookmap can reveal when a liquidation event is likely to produce outsized price movement.
Macro catalyst alignment. Liquidation cascades that coincide with macroeconomic events — Federal Reserve announcements, CPI data releases, or major regulatory news — tend to be more severe because fundamental selling compounds the mechanical forced selling.
Tactical Entry Framework
Positioning ahead of a liquidation event requires patience and precision. The goal is not to front-run the cascade — attempting to catch a falling knife mid-cascade is a common and costly mistake. The objective is to identify the likely exhaustion point of the selling pressure and enter after the cascade has burned through the majority of its fuel.
A practical approach involves three phases:
Phase One — Preparation. Identify a significant liquidation cluster on the heatmap below current price. Confirm that open interest is elevated and funding rates are stretched to the long side. Establish a target entry zone slightly below the liquidation cluster, where the cascade's selling pressure is likely to exhaust.
Phase Two — Monitoring. As price approaches the liquidation zone, watch real-time liquidation data on CoinGlass for evidence that the cascade is beginning. A sudden spike in liquidation volume — visible as a sharp uptick on the liquidation chart — signals that the mechanical selling is underway.
Phase Three — Entry. Wait for the liquidation volume to peak and begin declining before entering. This inflection point — where forced selling is tapering but price has not yet recovered — represents the highest-probability entry window. Use limit orders rather than market orders to avoid unnecessary slippage in a volatile, low-liquidity environment.
Risk Management Is Non-Negotiable
Trading around liquidation events is a high-conviction, high-risk strategy. The same dynamics that create opportunity can compound losses if timing is misjudged. Several risk parameters must be enforced without exception.
Position sizing should reflect the elevated volatility inherent in these scenarios. A position sized for a stable market environment is dangerously large in a liquidation cascade context. At King88 Group, we advocate for reducing standard position size by at least 30% when entering around forced-selling events until the trader has accumulated sufficient experience with cascade behavior.
Stop-loss placement must account for the possibility of a secondary cascade. Price often finds temporary support after the first wave of liquidations, only to breach that level again when a second cluster is triggered. Stops placed too tightly below entry are frequently taken out before the anticipated recovery materializes.
Finally, understand that not every heatmap cluster produces a cascade. Liquidation data describes potential energy, not inevitable outcomes. Price can reverse before reaching a liquidation zone, leaving the anticipated trade setup unrealized. Discipline in waiting for confirmation — rather than anticipating prematurely — is what separates traders who profit from this framework from those who simply develop a more elaborate rationale for poor entries.
The Structural Edge in Forced Selling
Crypto markets are uniquely transparent compared to traditional financial markets. Liquidation data, funding rates, and open interest figures are publicly accessible in real time — a structural advantage that informed traders can exploit in ways that are simply not available in equities or fixed income.
The forced exits of overleveraged traders are an inevitable feature of this market. They will occur in every cycle, across every major asset, on every major platform. The question for the serious investor is not whether these events will happen — it is whether you will be watching from the sidelines or positioned to benefit when they do.